TODO: move this entirely to a colab notebook, and only keep some key figures on this page. — also add more code to get radial averages (maybe even with errors), not just the coordinates.
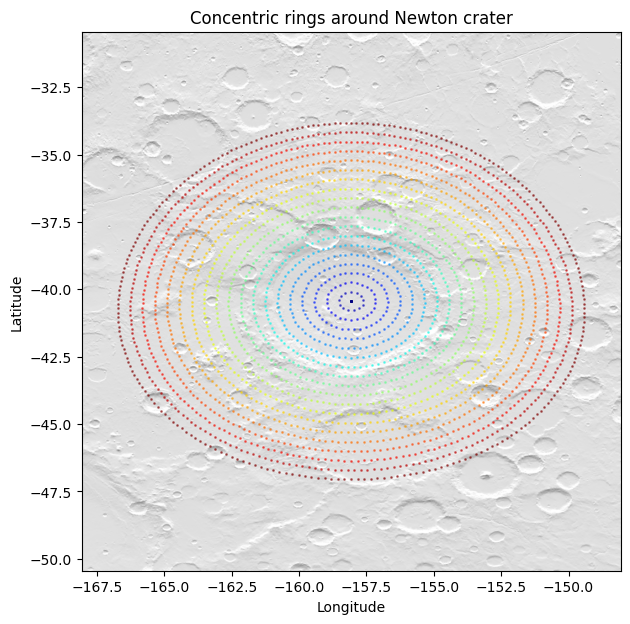
Here's a sample plot of output ring coordinates around Newton crater, where each ring is a different color and we dramatically undersample the points on each ring for clarity (20 rings, 10km between points on each ring):
importnumpyasnpimportmatplotlib.pyplotaspltimportredplanetasrp## get crater datacrater=rp.Craters.get(name='Newton',as_dict=True)[0]## get concentric ring coordinatesring_radius_km__per_ring,ring_coords__per_ring=rp.analysis.radial_profile.get_concentric_ring_coords(lon=crater['lon'],lat=crater['lat'],radius_km=(crater['diam']/2)*2.5,num_rings=20,dist_btwn_points_km=10,)## plot hillshade (base)r=10lons=np.linspace(crater['lon']-r,crater['lon']+r,1000)lats=np.linspace(crater['lat']-r,crater['lat']+r,1000)rp.Crust.topo.load('DEM_463m')fig,ax=rp.plot(lons,lats,dat=rp.Crust.topo.get(lons,lats),figsize=(7,7),hillshade=True,cbar=False,alpha_dat=0,alpha_hs=0.5,show=False,)## plot concentric ringscolors__per_ring=plt.cm.jet(np.linspace(0,1,len(ring_radius_km__per_ring)))foriinrange(len(ring_radius_km__per_ring)):ax.scatter(ring_coords__per_ring[i][:,0],ring_coords__per_ring[i][:,1],color=colors__per_ring[i],s=1,alpha=0.5,)ax.set_title(f'Concentric rings around {crater["name"]} crater')plt.show()